Milky Way from Vulpecula to Aquila
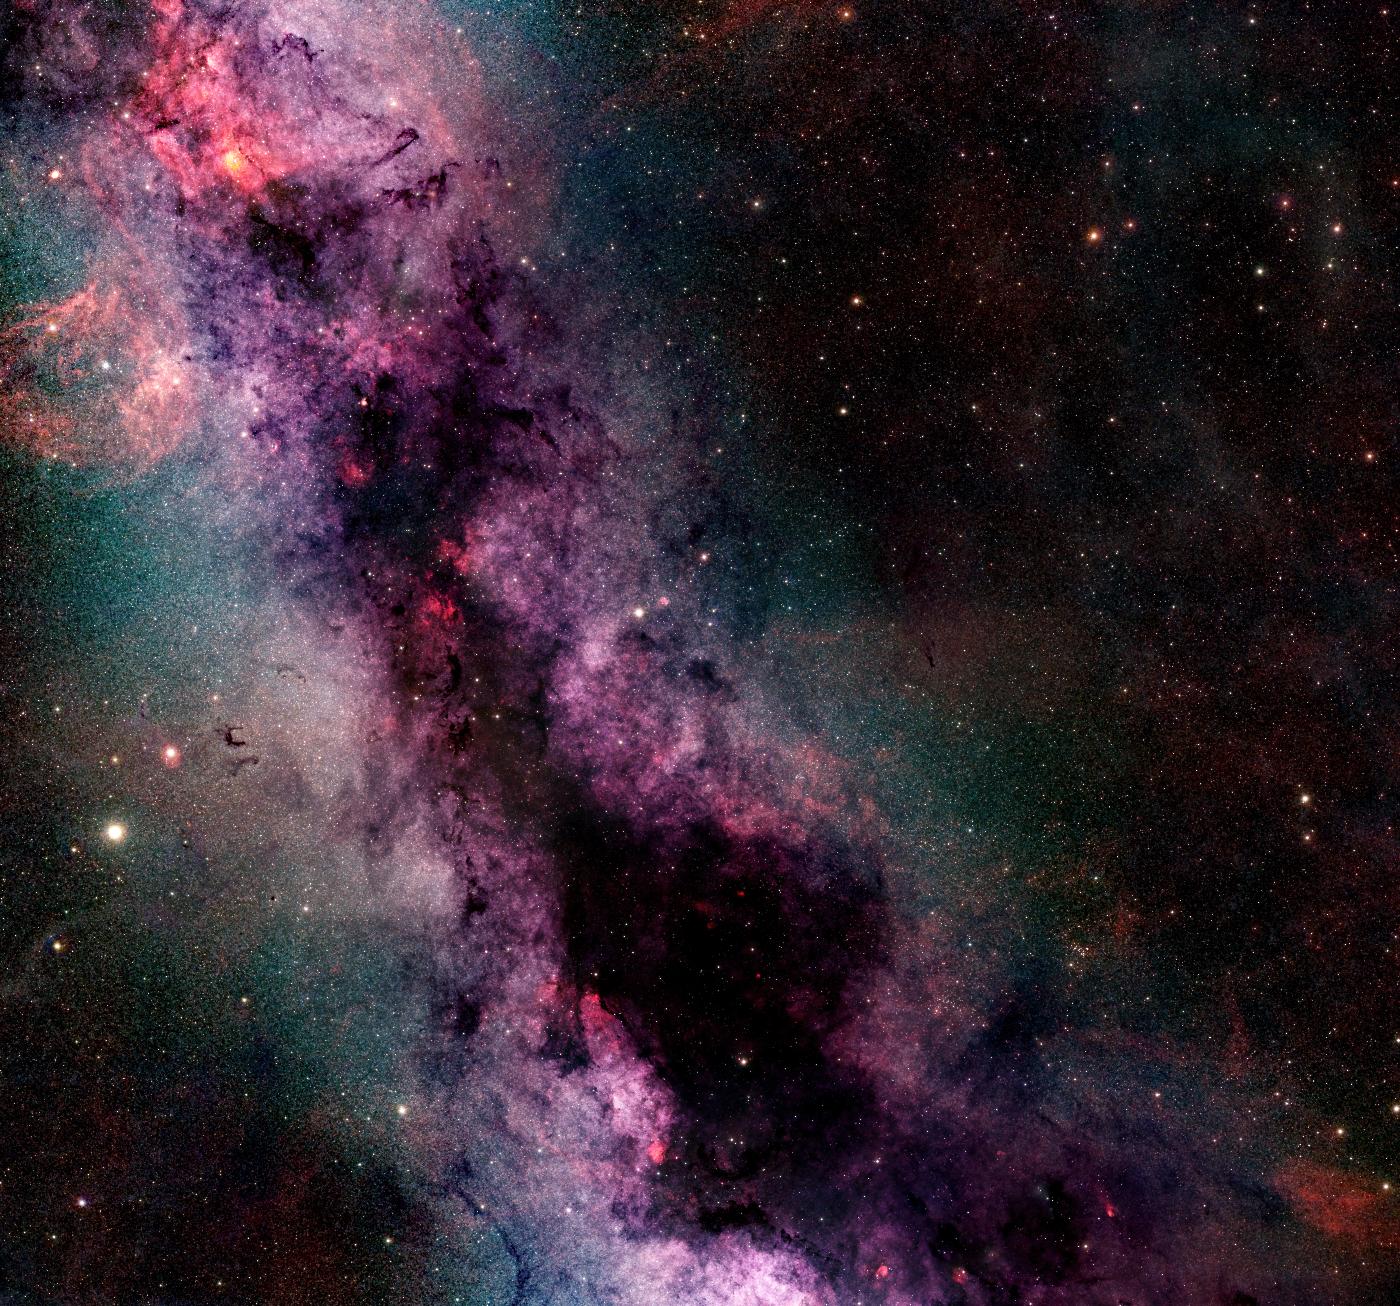
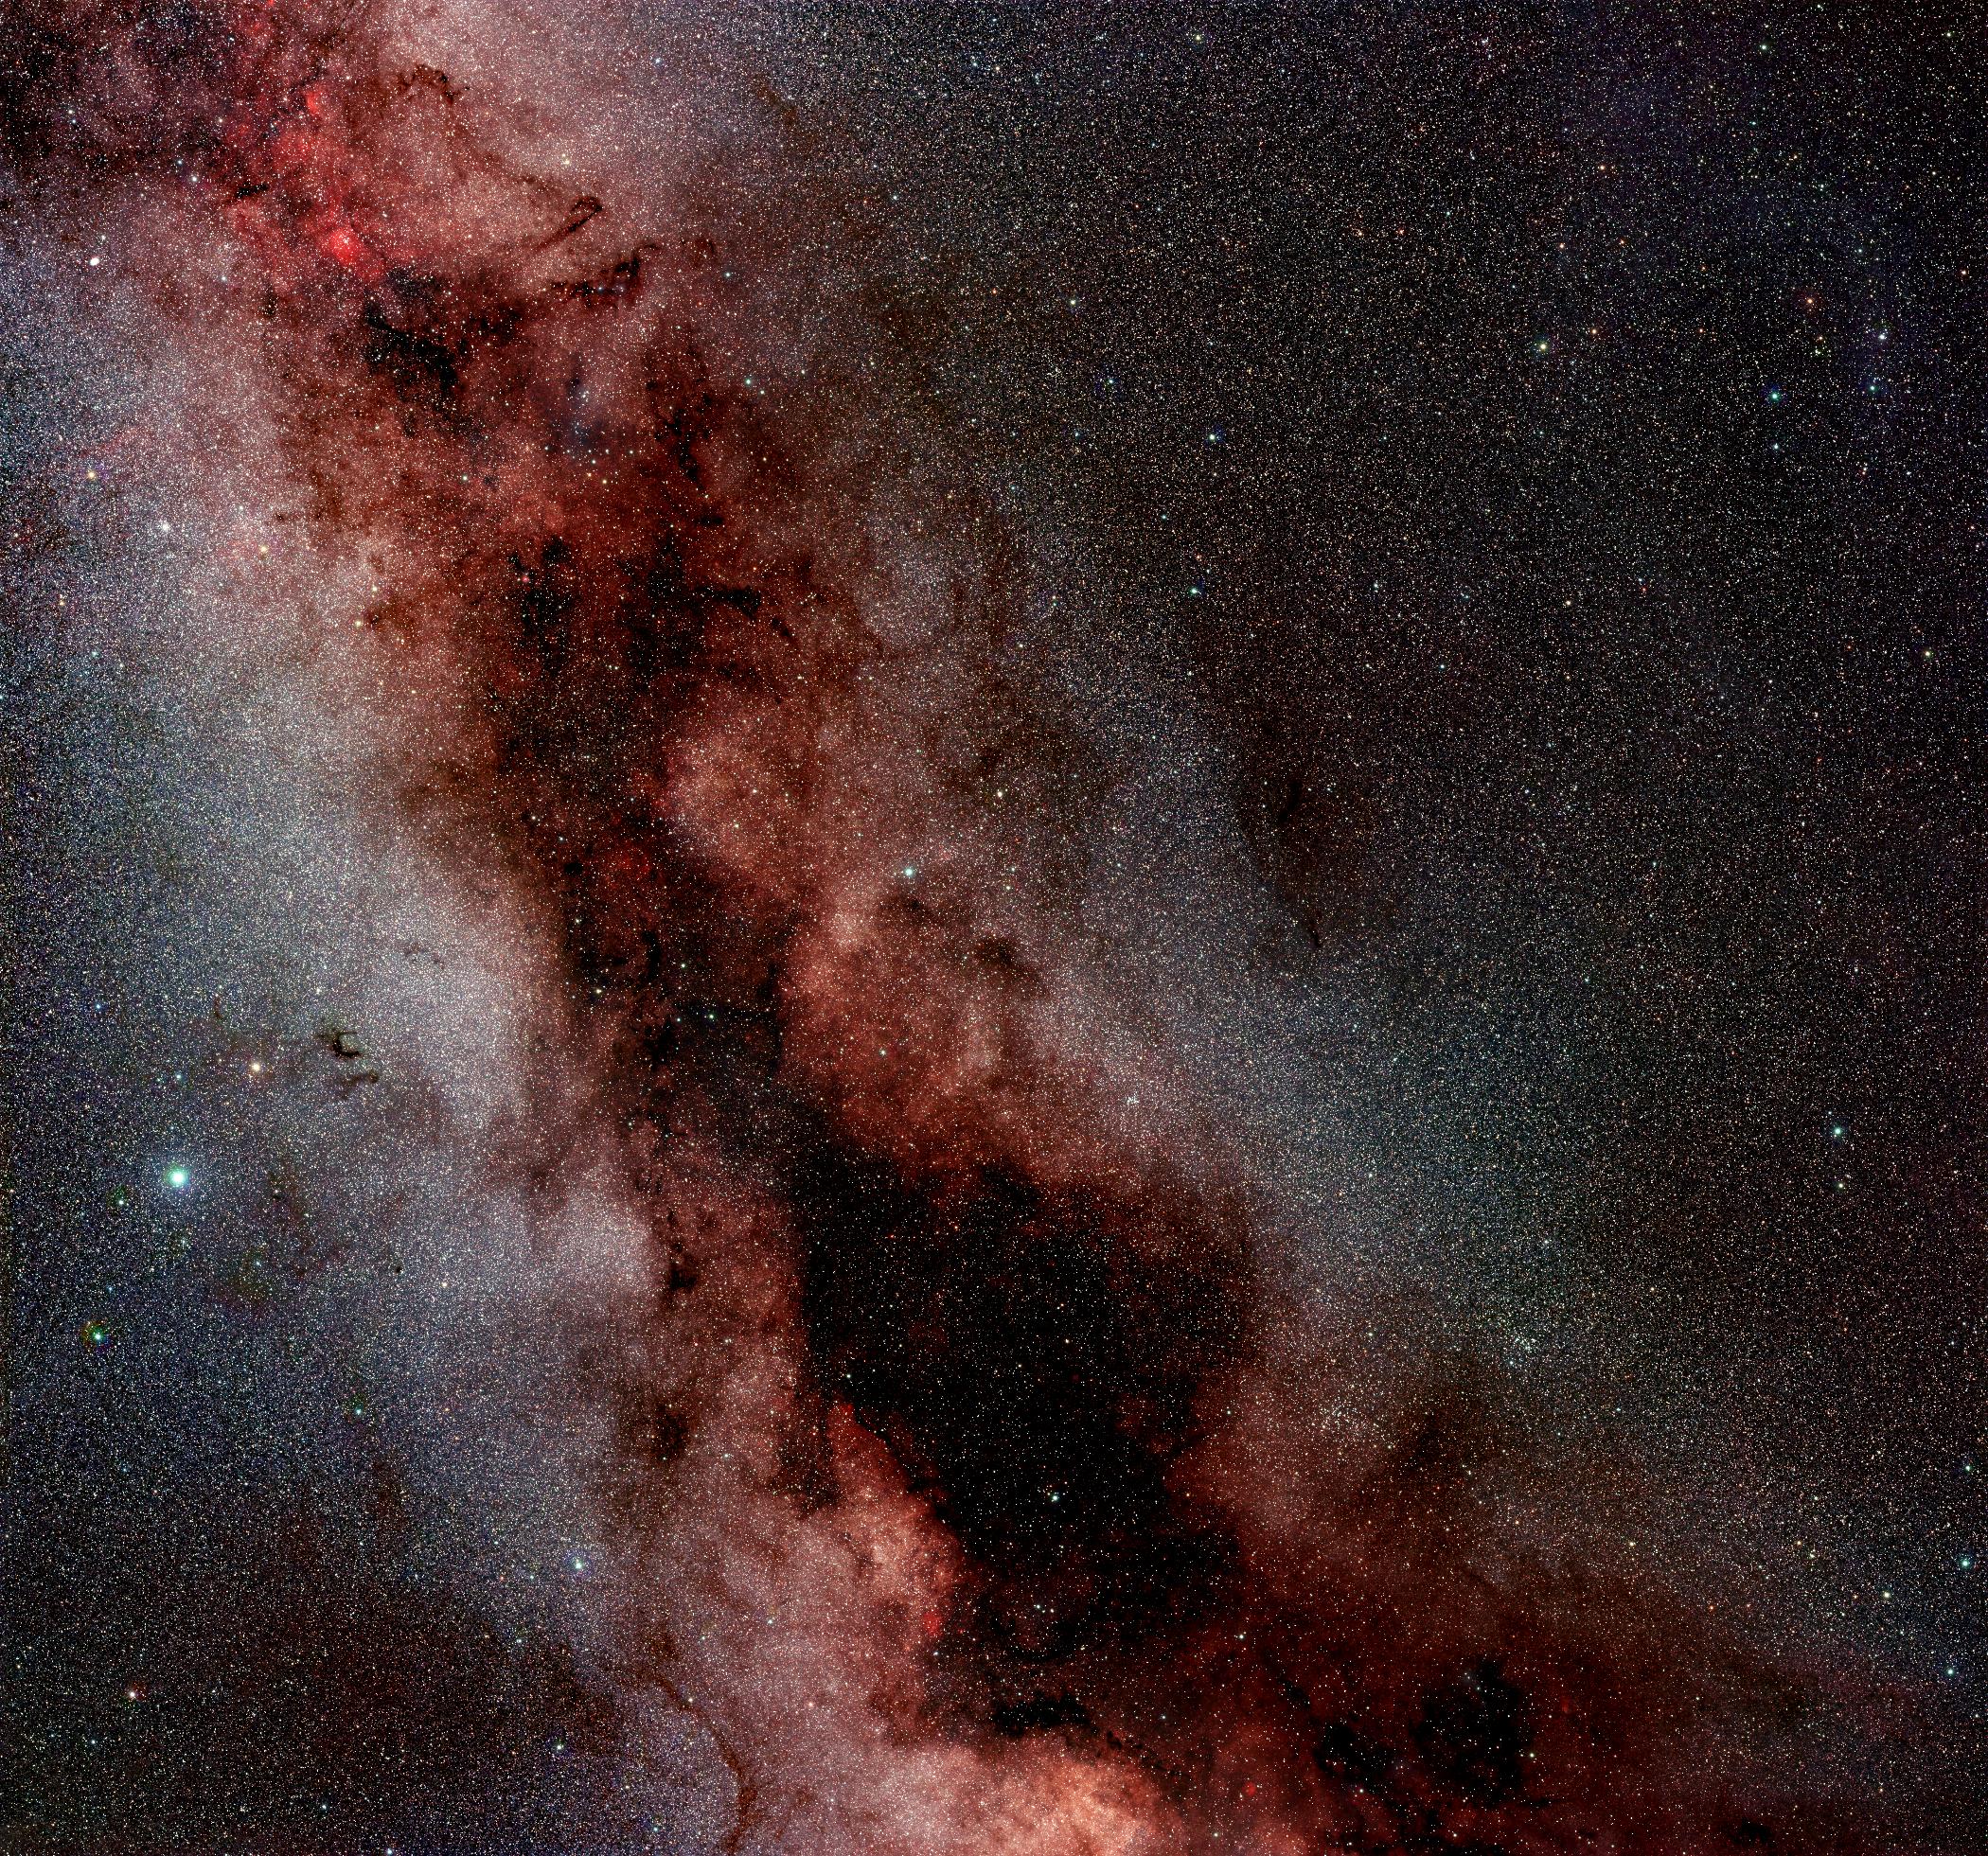
On this page a 30°×28° wide-field view of the Milky Way in the constellations Vulpecula, Sagitta and Aquila is presented in different color composites. That region is characterized dense dark nebulae at the galactic plane and only a few larger emission nebulae in constellation Vulpecula.
All pictures below are downscaled versions. Full resolution images with more than 100 megapixels can be loaded with a Javascript viewer by clicking on the images in the first section. The second section presents some discoveries. Image and instrument data can be found at the end of this page.
Full views and selected details
Click on the images to load a full resolution version with more than 100 megapixels using a JavaScript viewer.

Due to the limited resolution of continuum channels, the image is only presented at half resolution.


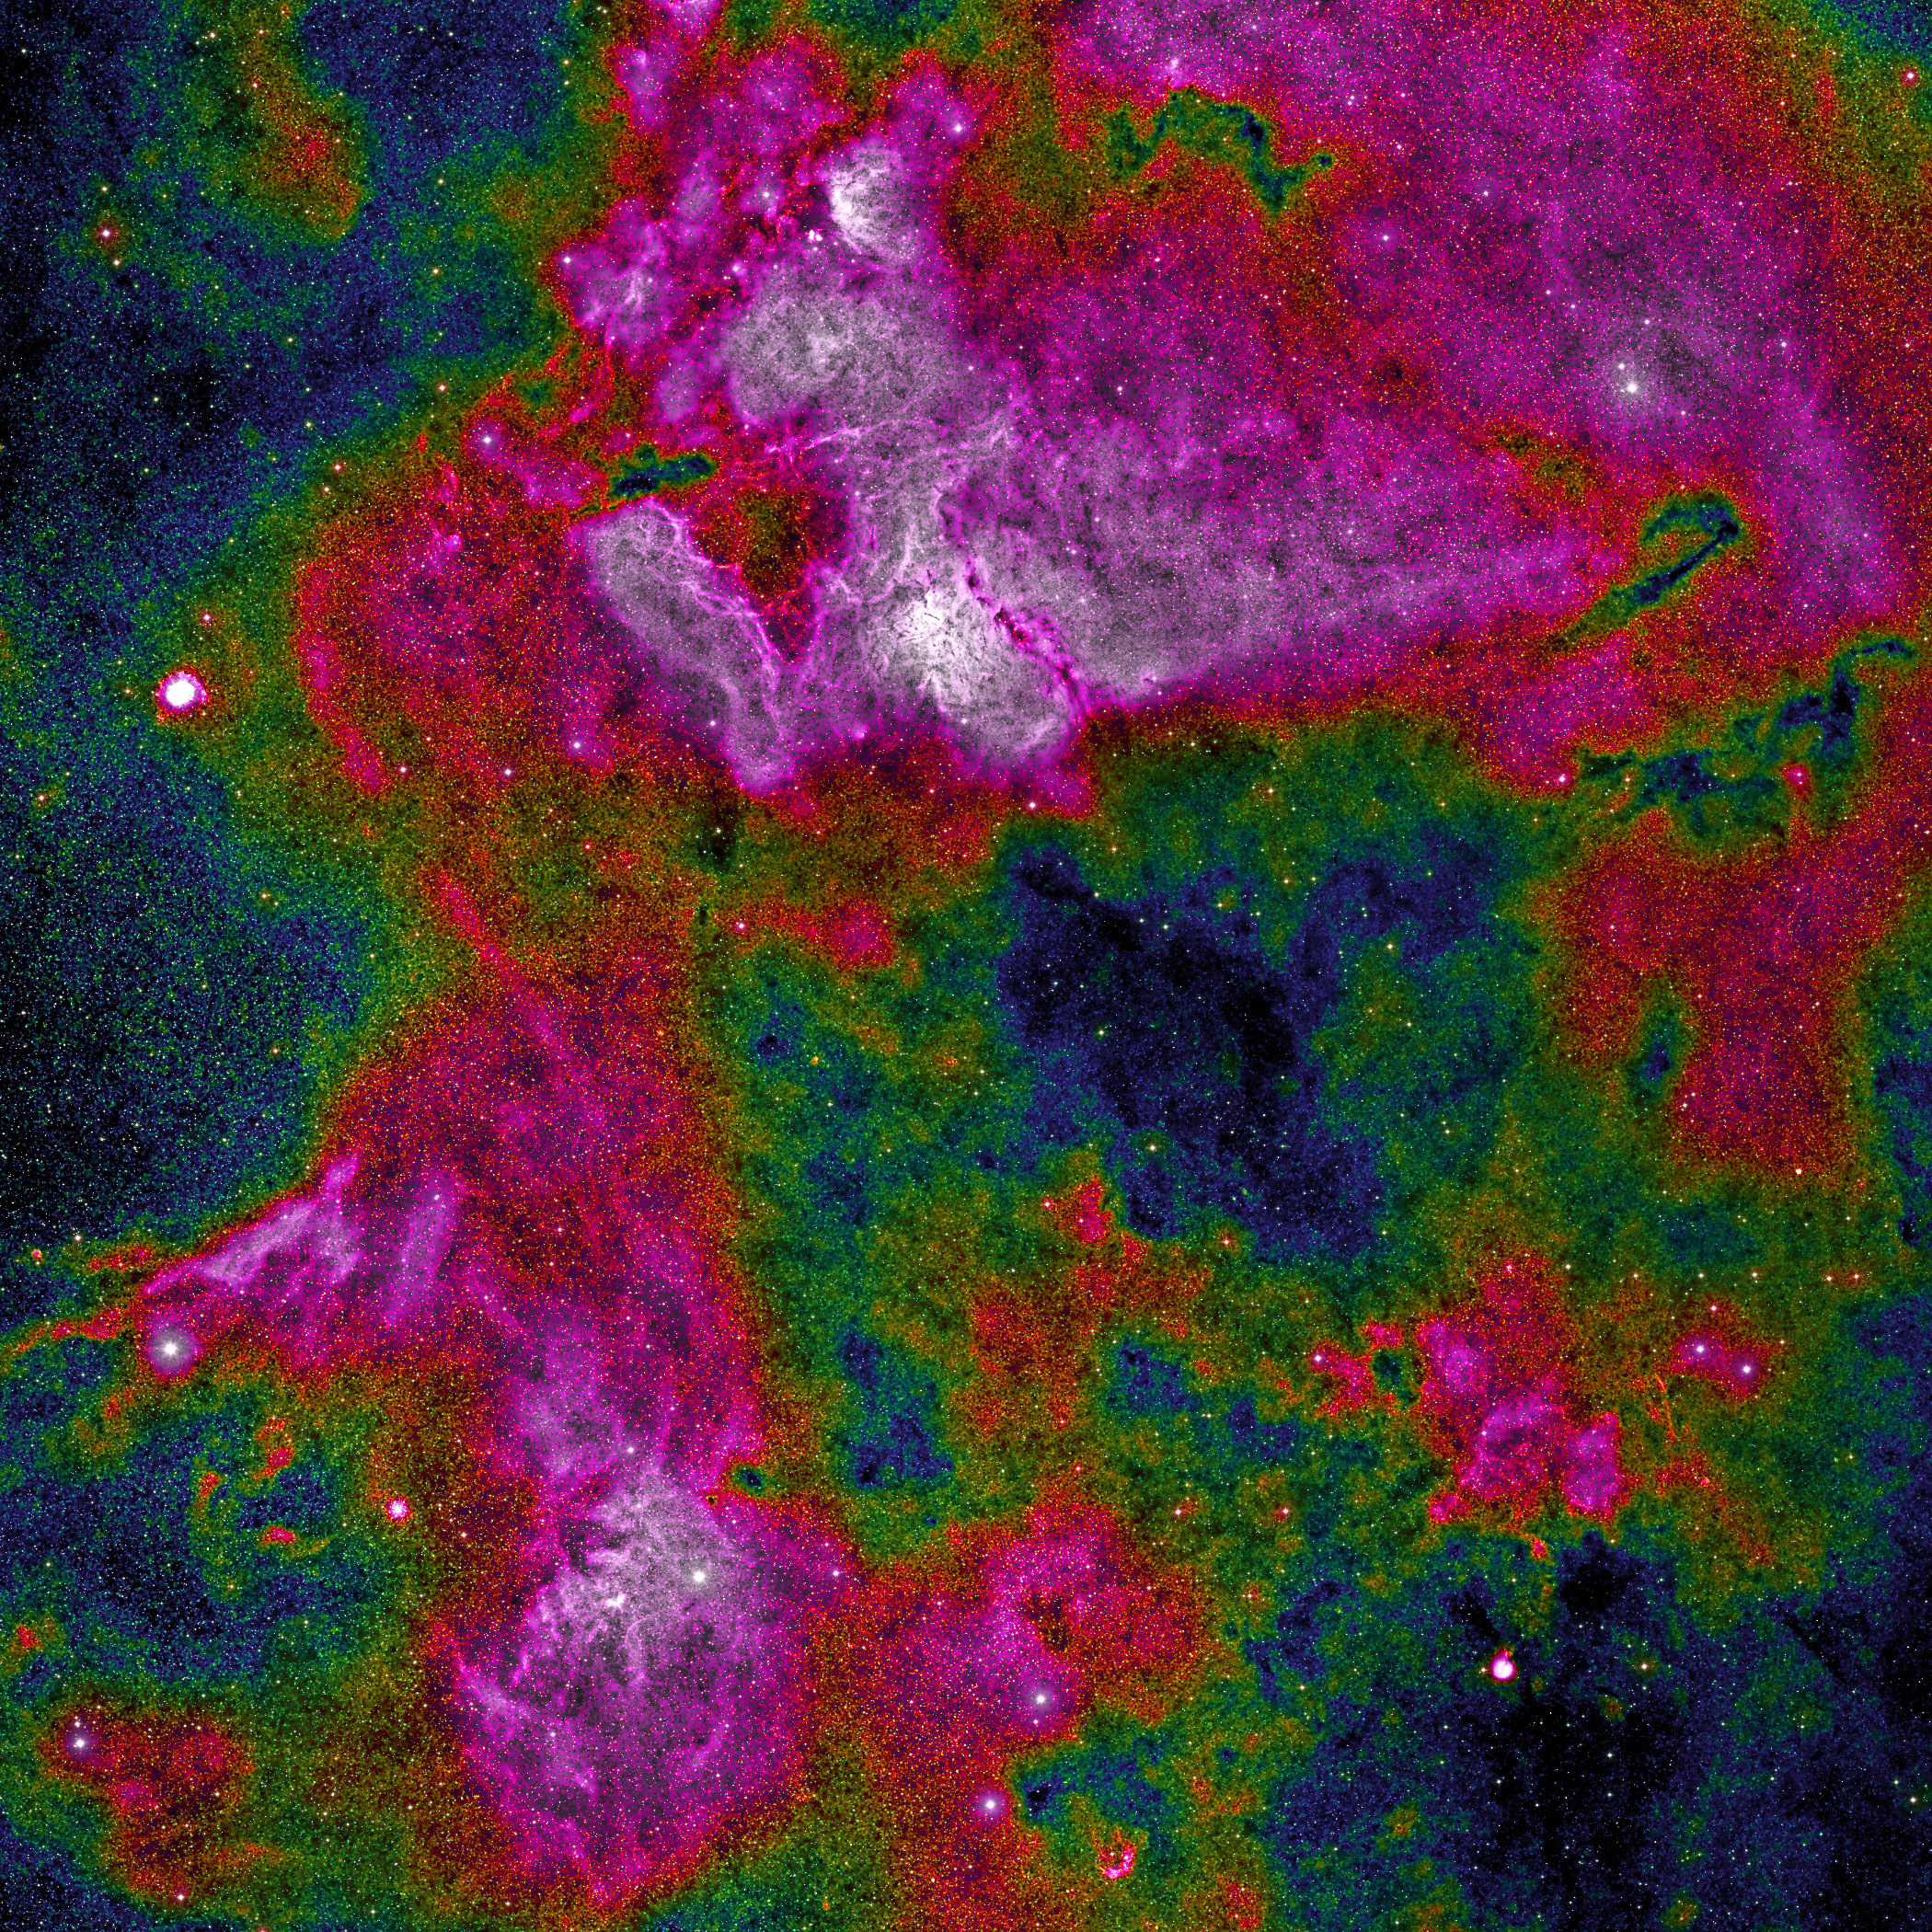
The picture shows a region in Vulpecula and Sagitta (the top left corner of the full view) as a pseudo color image calculated from H-alpha data.
The full view can be loaded by clicking on the image.
The large HII region in the upper half of the image contains SH2-86 to SH2-88 and DU 26 to DU 30 and is ionized by the VUL OB1 association which lies in a distance of about 7500 light years (distance of NGC 6823 according to Gaia EDR3, the ionization source of SH2-86).
The brightest nebulae of the large HII region in the lower half of the image are SH2-84 and DU 25. Indeed, both HII regions are much larger than the objects cataloged by now, also see the discoveries.
(In the JavaScript viewer the outlines of the mentioned objects can be plotted by pressing the '3' key or via menu.)
The bright spot near the left border is the planetary Nebula M27.
Please note that narrow band filters for emission lines (like H-alpha) always also capture more or less (depending on the width of the pass band) continuum light. That continuum component was not subtracted.
In the detail shown here H-alpha data are dominated by light from the emission line. Most structures in remaining part of the full view either come from continuum light or from the dark nebulae that lie in front.
Color composition: After partial star subtraction the dynamic range was compressed using a non-linear hi-pass filter. This results in a compression ratio r which is used to calculate the color as depicted in the legend.
(The legend shows the compression c:=1-r). Blue regions are compressed the least while white regions are compressed the most. Luminance is determined by the tonal curve corrected result of the dynamic range compression.
Discoveries
The views above show many HII regions that cannot be found in catalogs. (The JavaScript Viewer allows identifying objects using catalogs or SIMBAD and defining new objects.) Some (probably not all) of these unexplored nebulae have been collected in the list below. Click on the following links for a presentation. Notes Notes- In the JavaScript viewer, the object outlines can be toggled on and off by pressing the '2' key. This can be helpful to make certain structures (e.g. rings) visible.
- False color images containing H-alpha and continuum:
- H-alpha is mapped to red, blue continuum is mapped to green, and red continuum (without H-alpha) is mapped to blue.
- Color of molecular clouds and reflection nebulae in the false color image is something between green (bluish in reality) and blue (reddish in reality).
- HII regions (ionized hydrogen) appear red to orange, depending on the amount of OIII (doubly ionized oxygen) detected by the blue continuum filter.
- SIMBAD queries for certain object types can be made easily in the JavaScript Viewer by drawing a circle and pressing a shortcut key or via the menu
- A repository with the discoveries can also be found on GitHub
Image data
Images where captured with a camera array which is described on the instruments page.Image data are:
| Projection type: | Stereographic | ||||
|---|---|---|---|---|---|
| Center position: | RA: 19h, DEC: 13° | ||||
| Orientation: | North is up | ||||
| Scale: | 10 arcsec/pixel (in center at maximum resolution) | ||||
| FOV: | 30°×28° (RA×DEC, through center) | ||||
| Exposure times: |
Sum of exposure times of all frames used to calculate the image.
|
Image processing
All image processing steps are deterministic, i.e. there was no manual retouching or any other kind of non-reproducible adjustment. The software which was used can be downloaded here.Image processing steps where:
- Bias correction, dark current subtraction, flatfield correction
- Alignment and brightness calibration using stars from reference image
- Stacking with masking unlikely values and background correction
- Star subtraction
- Denoising and deconvolution both components (stars and residual)
- RGB-composition (same factor for stars and residual for the true color composite)
- Dynamic range compression using non-linear high-pass filter
- Tonal curve correction
